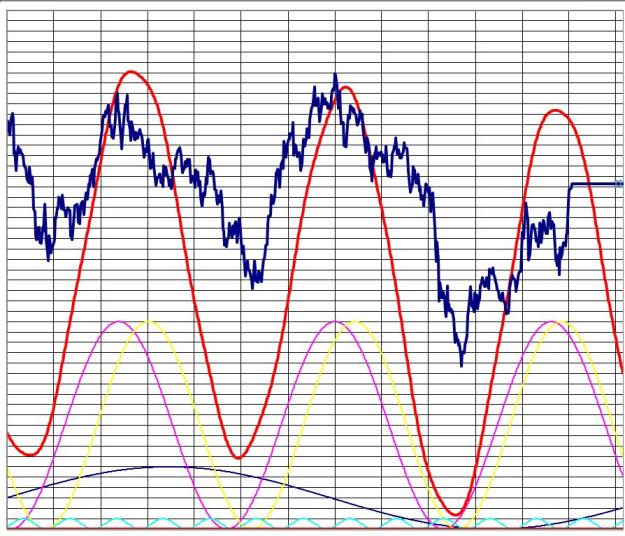
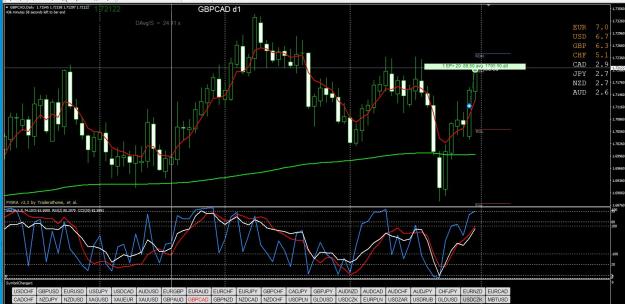
I'm sure you'll create a good system using it - 2RSI catches EVERY market cycle out there, tiny ones, big ones = you just have to refine to create a winning high probability strategy from it
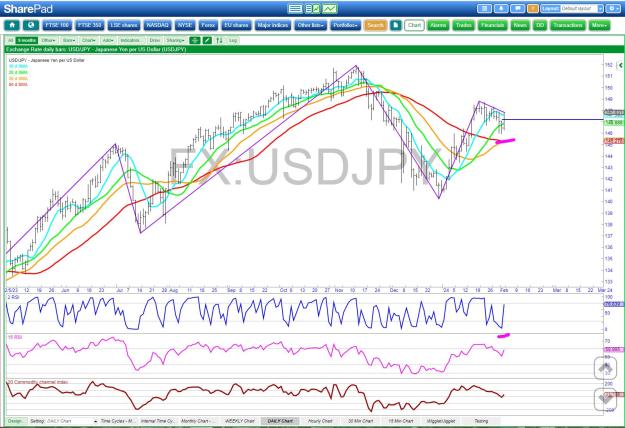
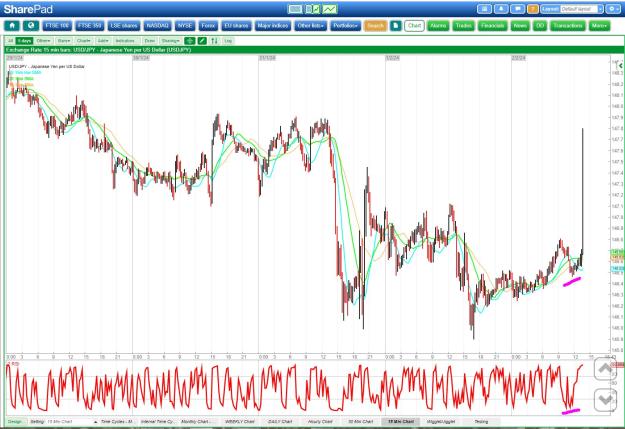
I use it on Monthly charts down to hourly
Welles Wilder created the RSI with a look back period of 14 as he was monitoring half a moon cycle
There's nothing wrong with tweaking an Indicators settings to match the peaks and troughs of a market - the catch is trading every signal, you'll go bust that way, but if you create a well defined trading method with rules, you'll win
I cannot believe so few people have written about this, over the years
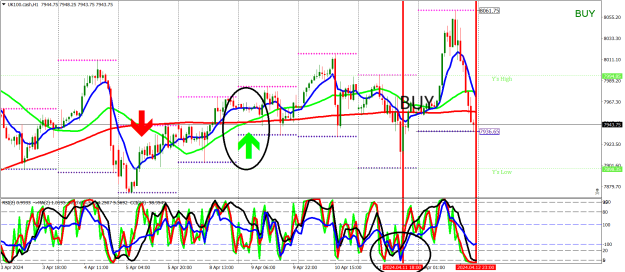
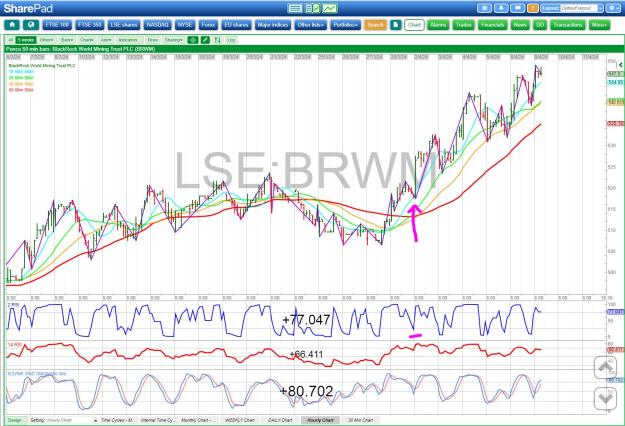
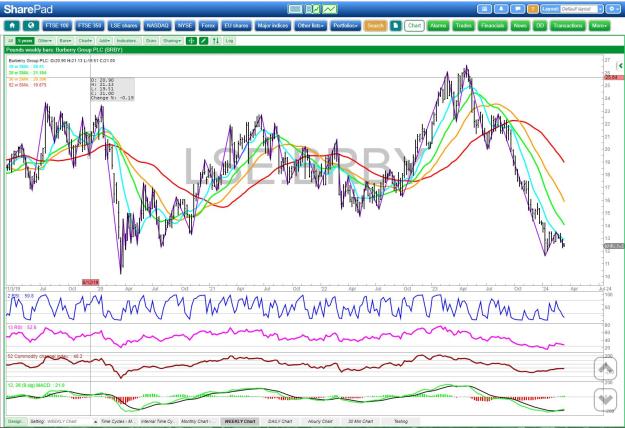
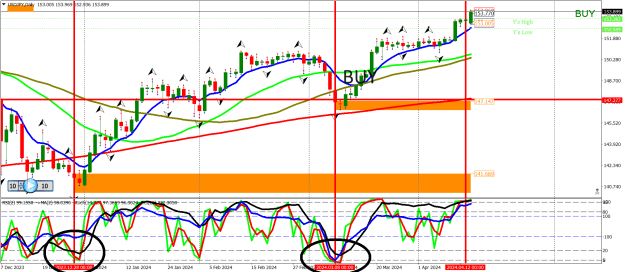
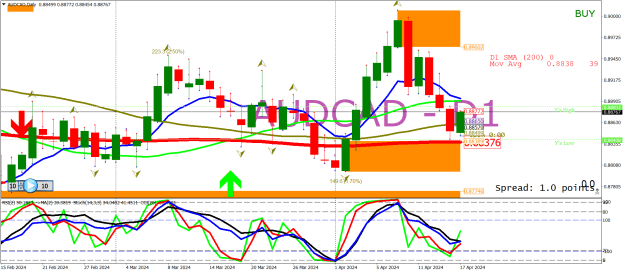
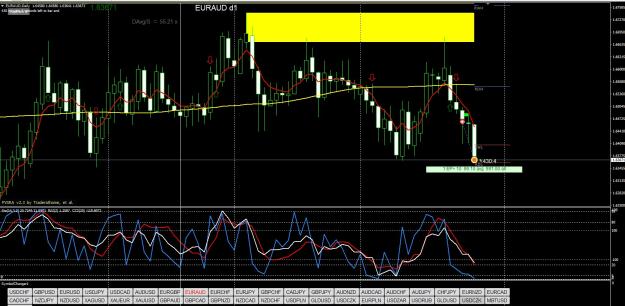
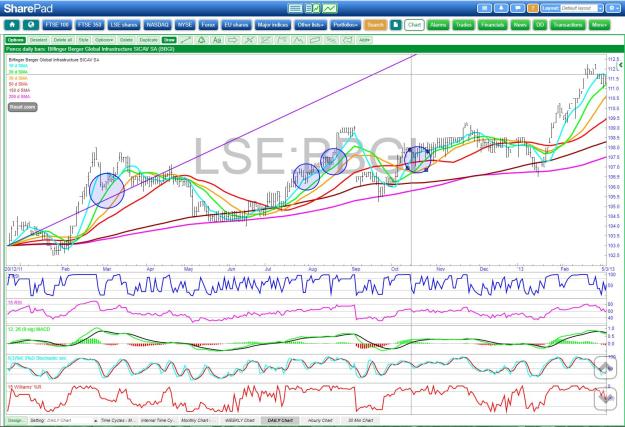
Let me pick a random UK share, DAILY time-frame and go back to 2010 and see if we can pick out a profitable trade from that time period - 2 secs:
This is a pretty poor example i'm afraid, as the market was not that liquid and my price data only goes back to 2011! Anyway, you can see my point about trade every turn of the Indicator and you'd go bust, create a meaningful trading method/plan and you can win
(Ignore the random purple trendline - the software has created that and it can't be removed)
Good luck on your trading journey
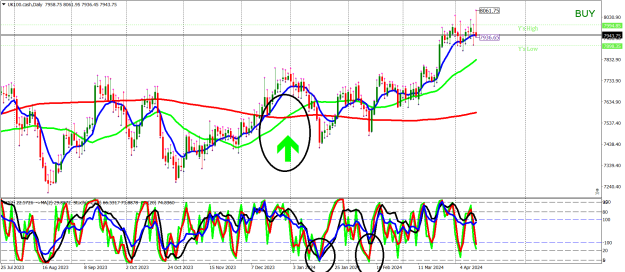
PS - We'd of never taken the 4th Blue circled trade - the range of the bar was wide - we want normal sized or preferably very narrow
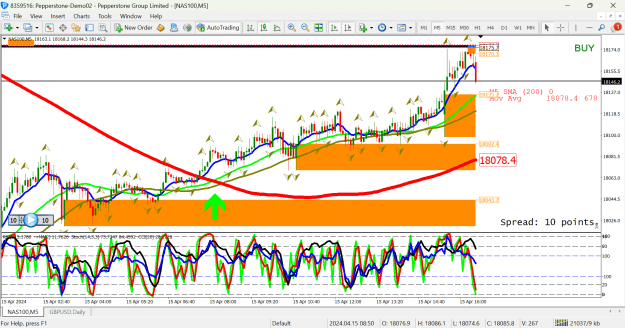
Here's a bonus:
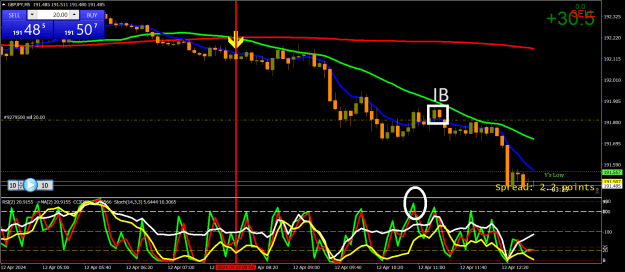
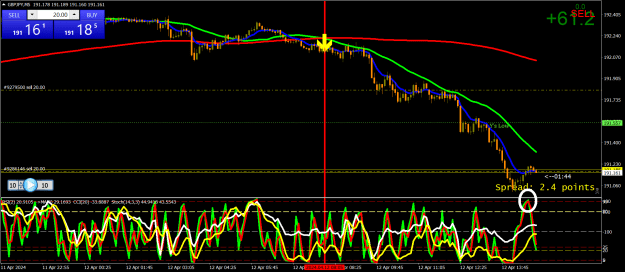
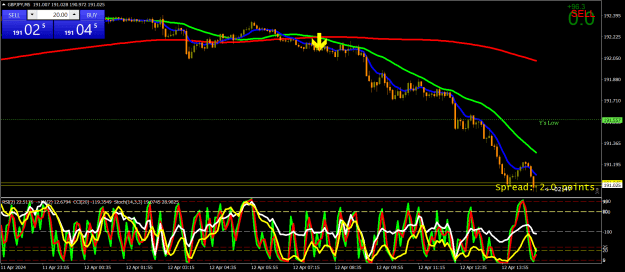
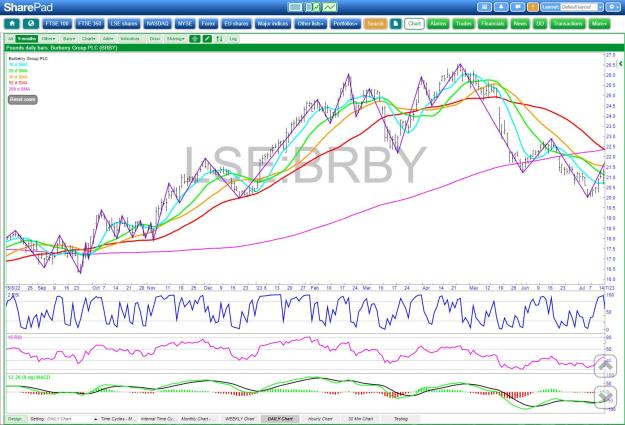
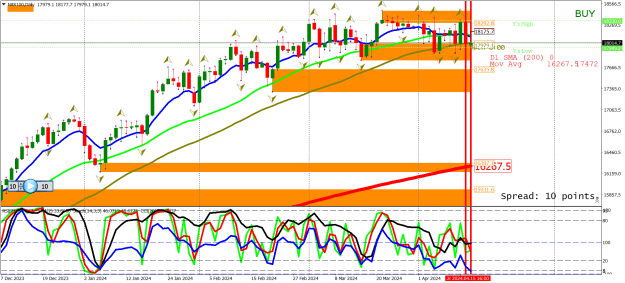
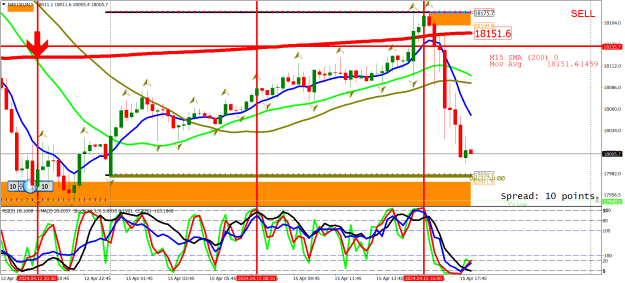
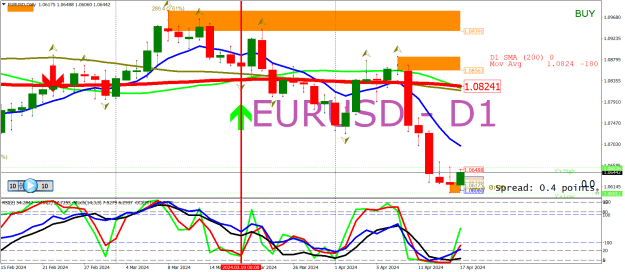
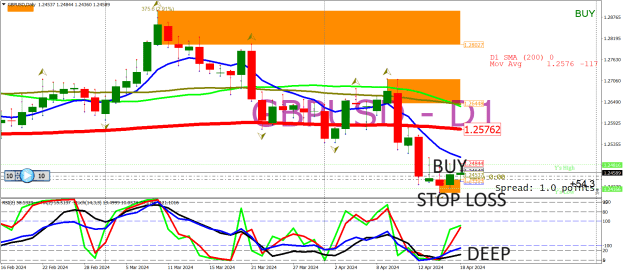
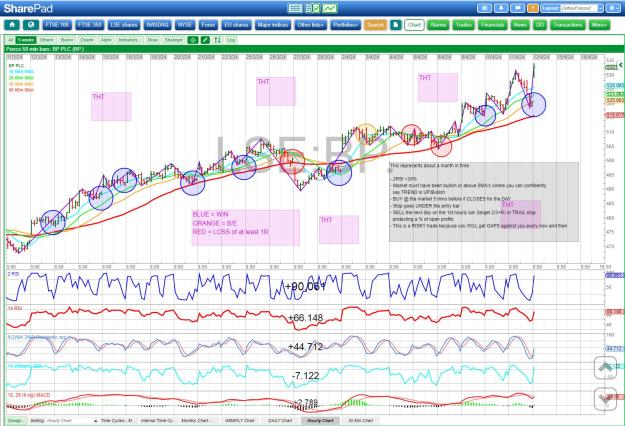
Details on the hourly chart - YOU HAVE TO BE AS CERTAIN on the TREND of the market as possible
In the UK our trading day finishes with a 30 min bar (4.30pm) - so it's often narrow and when that happens with the 2RSI <30% you often get a nice up move, often with a gap, the next morning at the open
In the chart below it has a 75% win rate, take the orange b/e trade as a loss and it moves to 66% win rate - you can see it makes more than 1R averaged out
The main risk of this is that you have to buy in at the prev days CLOSE, you will get gap down opens against you, its just going to happen, but when you get the trend right of the bigger picture daily moves, the play works out nice - but its risky
I use it on Monthly charts down to hourly
Welles Wilder created the RSI with a look back period of 14 as he was monitoring half a moon cycle
There's nothing wrong with tweaking an Indicators settings to match the peaks and troughs of a market - the catch is trading every signal, you'll go bust that way, but if you create a well defined trading method with rules, you'll win
I cannot believe so few people have written about this, over the years
Let me pick a random UK share, DAILY time-frame and go back to 2010 and see if we can pick out a profitable trade from that time period - 2 secs:
This is a pretty poor example i'm afraid, as the market was not that liquid and my price data only goes back to 2011! Anyway, you can see my point about trade every turn of the Indicator and you'd go bust, create a meaningful trading method/plan and you can win
(Ignore the random purple trendline - the software has created that and it can't be removed)
Good luck on your trading journey
PS - We'd of never taken the 4th Blue circled trade - the range of the bar was wide - we want normal sized or preferably very narrow
Attached Image (click to enlarge)
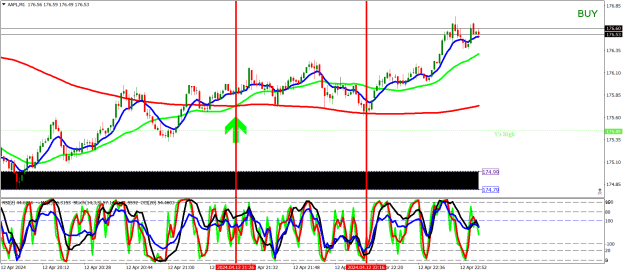
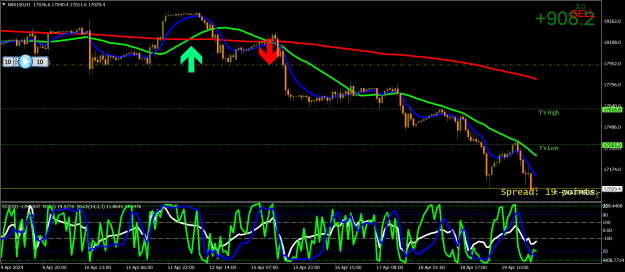
Here's a bonus:
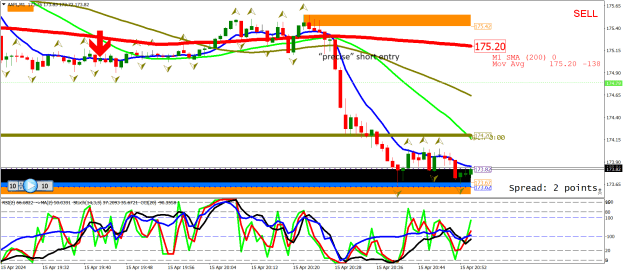
Details on the hourly chart - YOU HAVE TO BE AS CERTAIN on the TREND of the market as possible
In the UK our trading day finishes with a 30 min bar (4.30pm) - so it's often narrow and when that happens with the 2RSI <30% you often get a nice up move, often with a gap, the next morning at the open
In the chart below it has a 75% win rate, take the orange b/e trade as a loss and it moves to 66% win rate - you can see it makes more than 1R averaged out
The main risk of this is that you have to buy in at the prev days CLOSE, you will get gap down opens against you, its just going to happen, but when you get the trend right of the bigger picture daily moves, the play works out nice - but its risky
Attached Image (click to enlarge)
THT
1